Case study / Giesswein
Keep REVIEWS.io. Turn reviews into buying guidance.
For Giesswein’s relaunch, existing reviews need to do more than display stars. The implementation connects REVIEWS.io with Shopify: fit data helps customers choose a size, reviews match the new store design and ratings follow customers into search and cart. The existing review collection process in REVIEWS.io stays in place.
- Data source
- REVIEWS.io: reviews & fit data
- Integration
- SKU filtering, product mapping & sync
- Implementation
- Theme components based on Figma
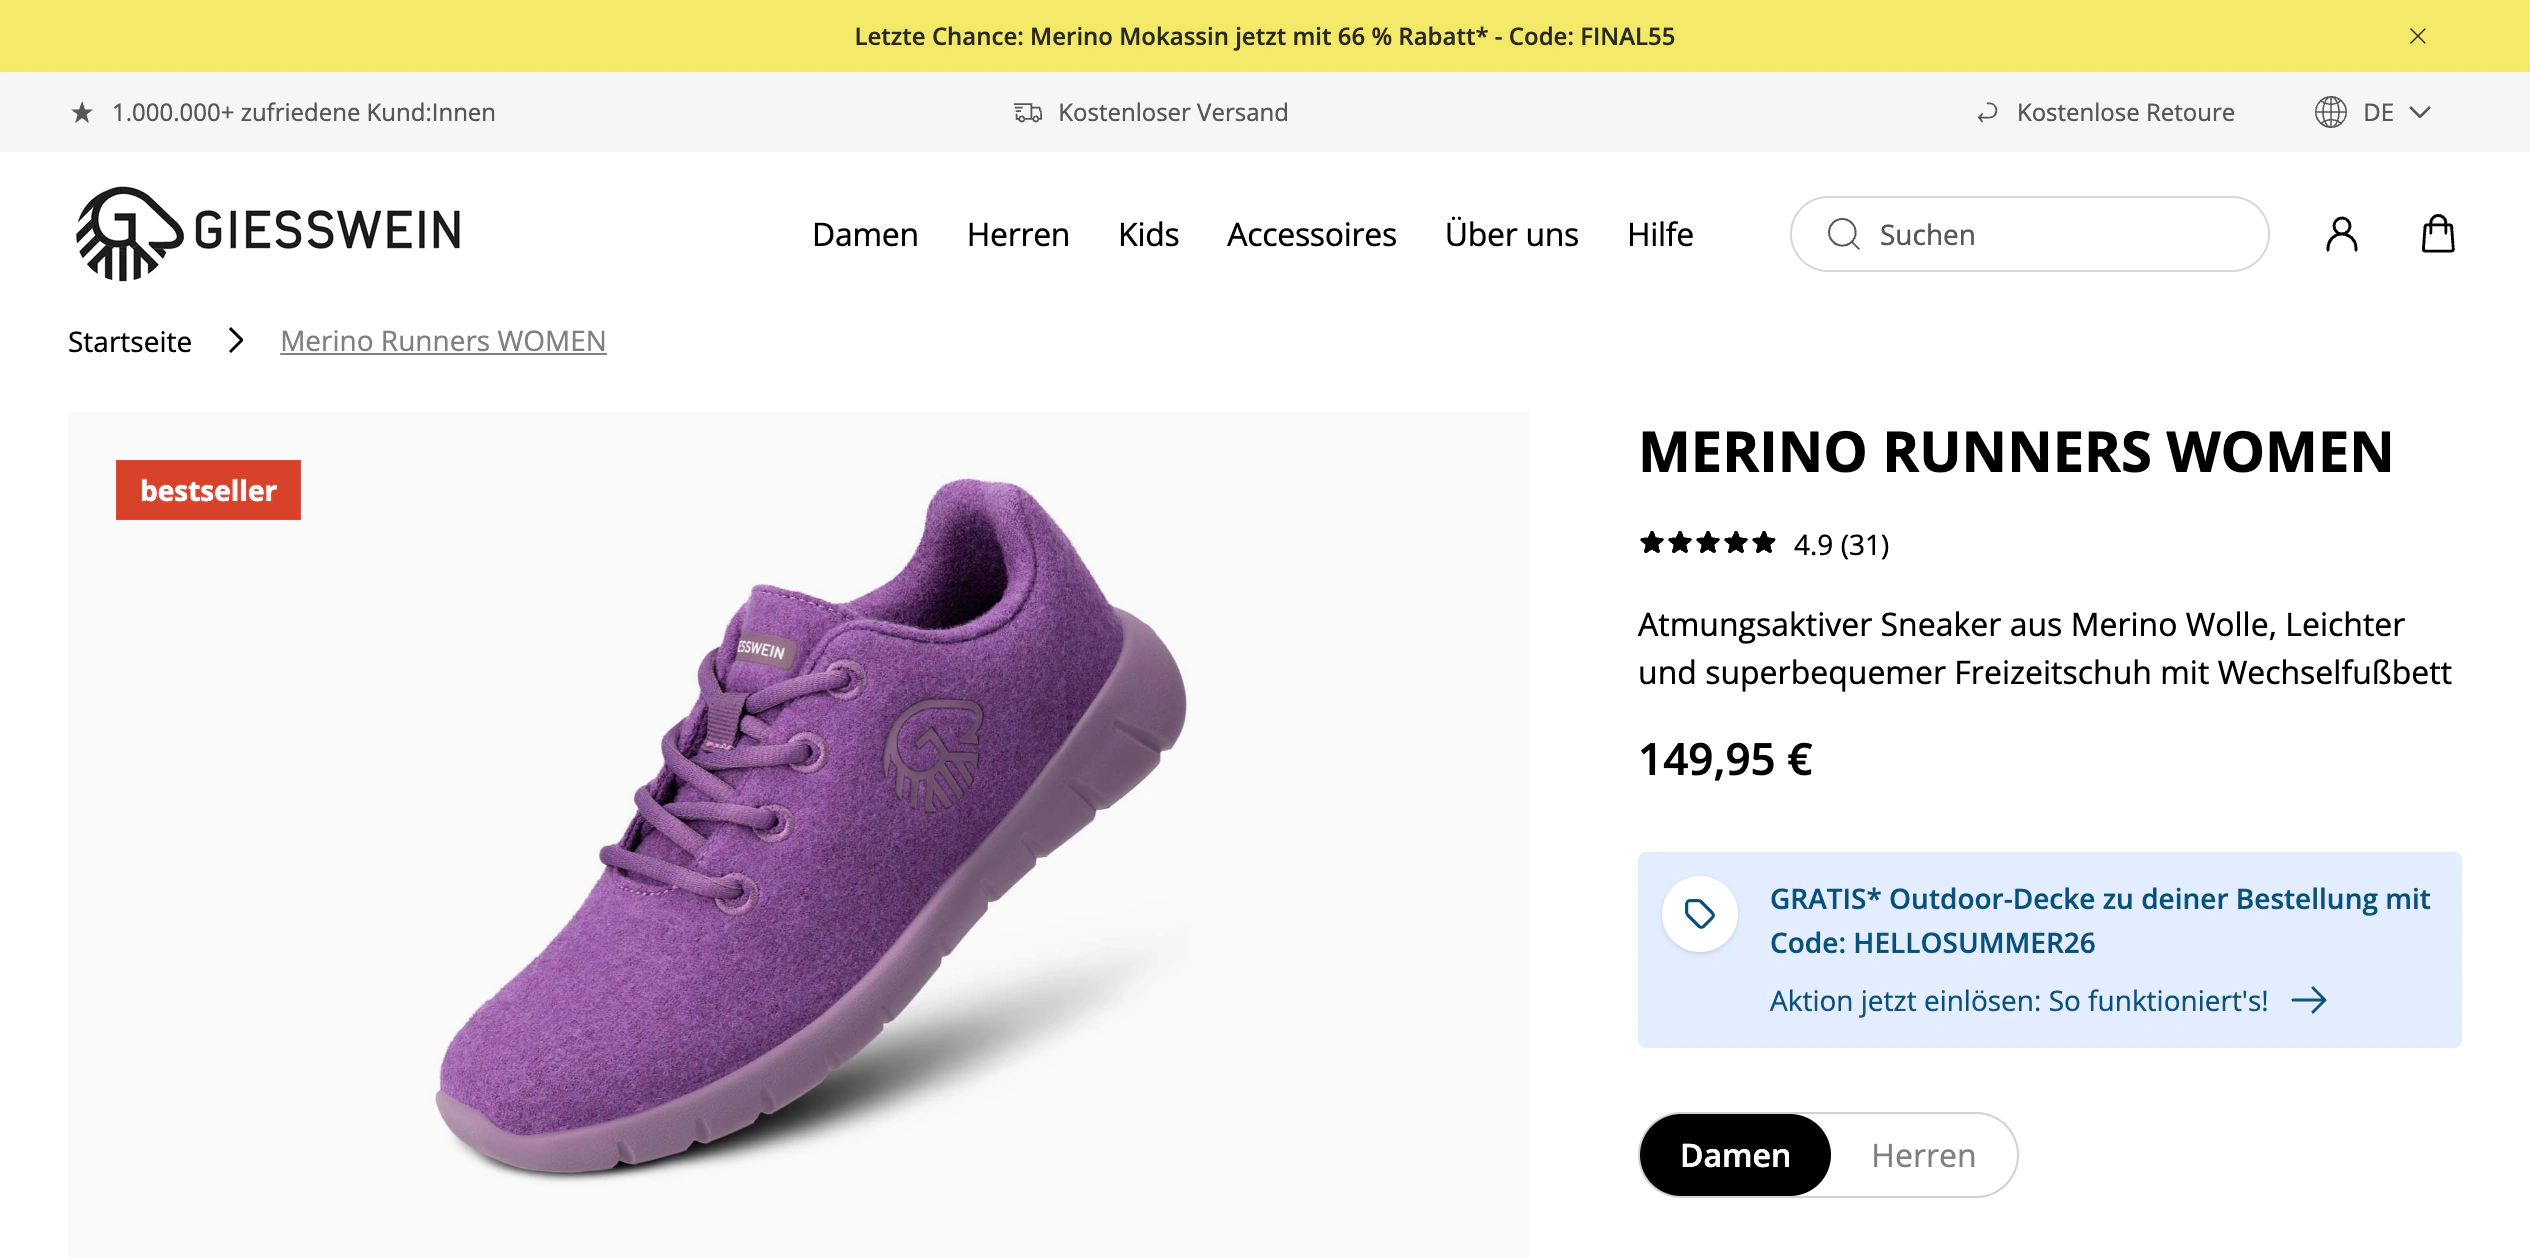
My contribution: Social proof integration as part of a relaunch with Eshop Guide: data integration, configuration, design customisation, placement and theme development.
01
Fit advice right where customers choose their size
Fit responses from REVIEWS.io become a specific size recommendation on the product page. The existing design block is connected to aggregated review data and extended with guidance: does the shoe run small, true to size or large? The number of underlying responses appears alongside it.
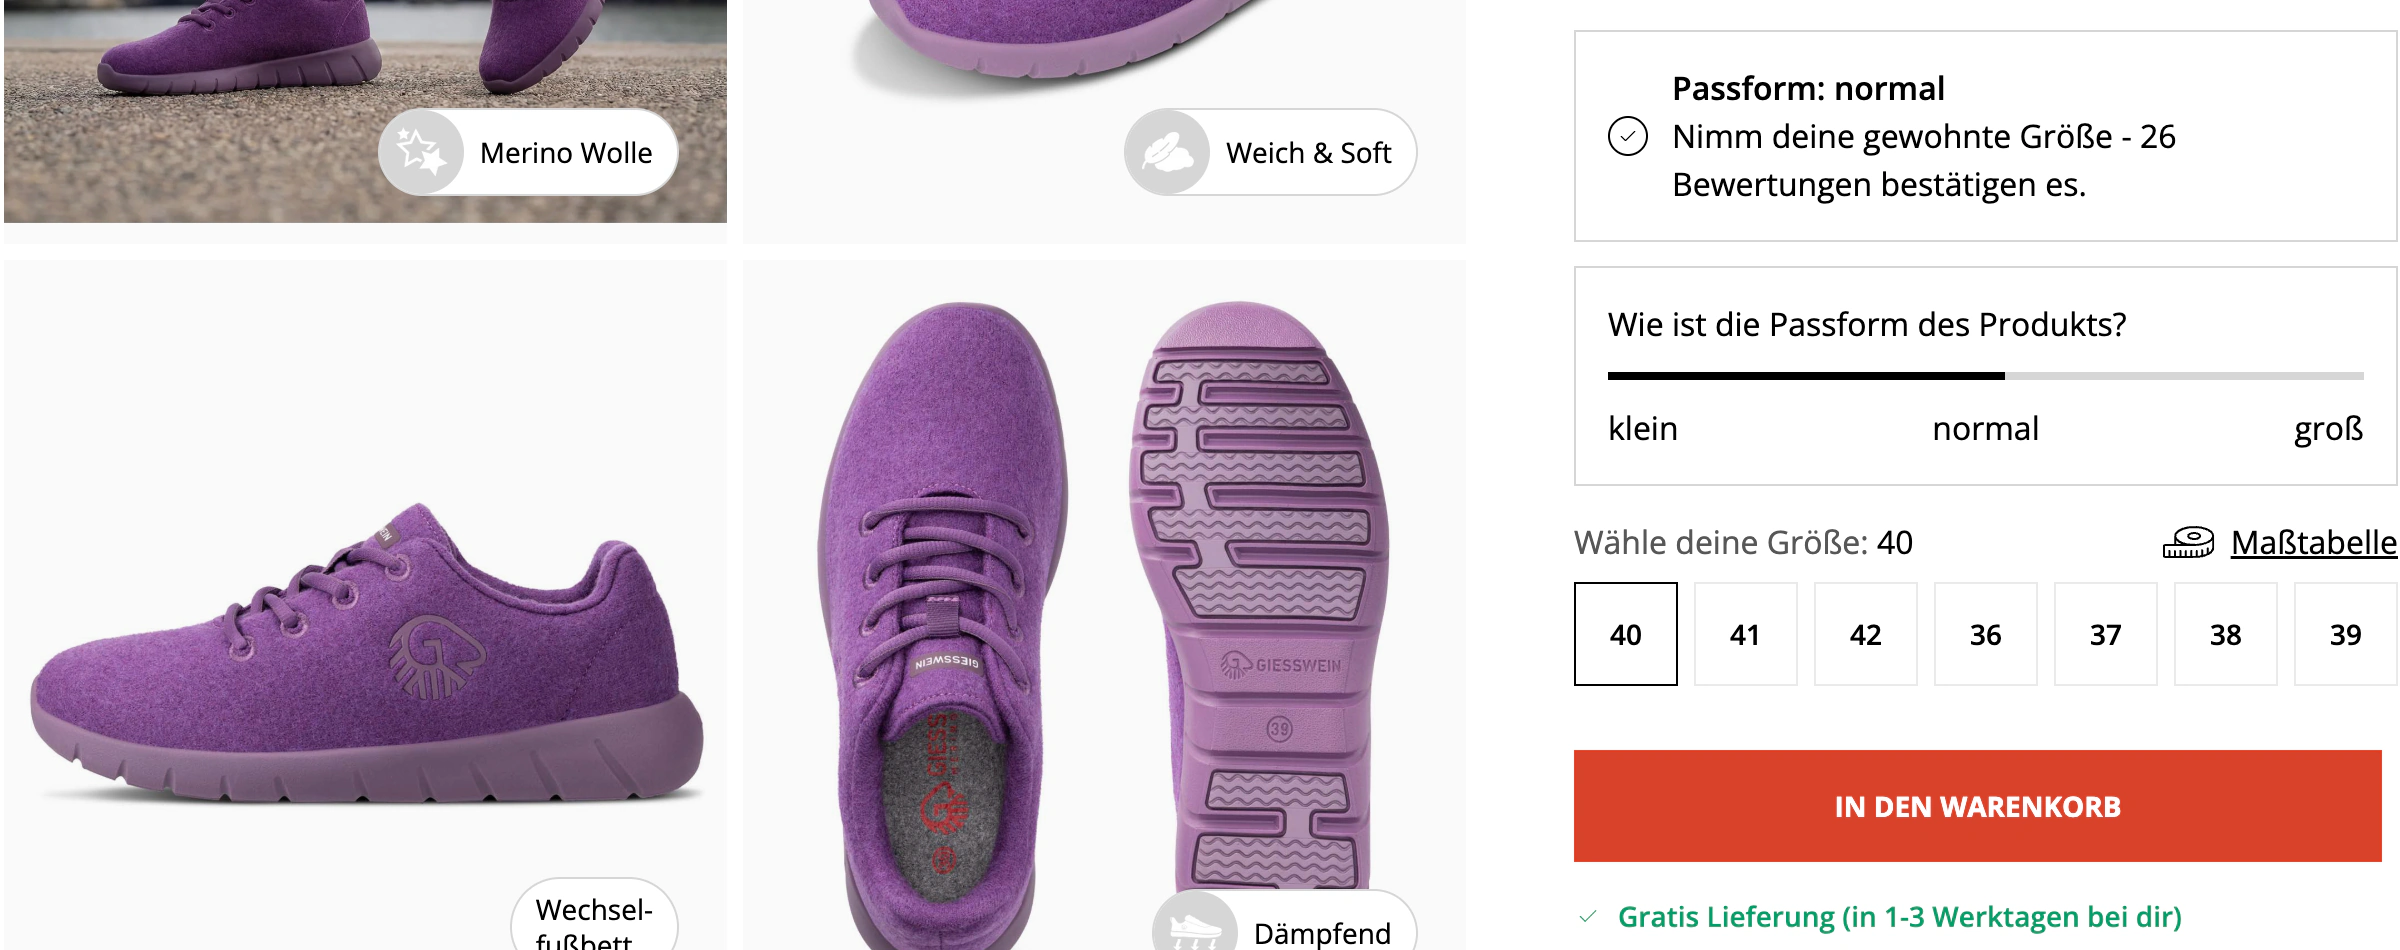
The scale position is calculated from the imported attribute values. Thresholds, labels and recommendation text can be configured in the theme editor. Without fit responses, the block stays hidden.
02
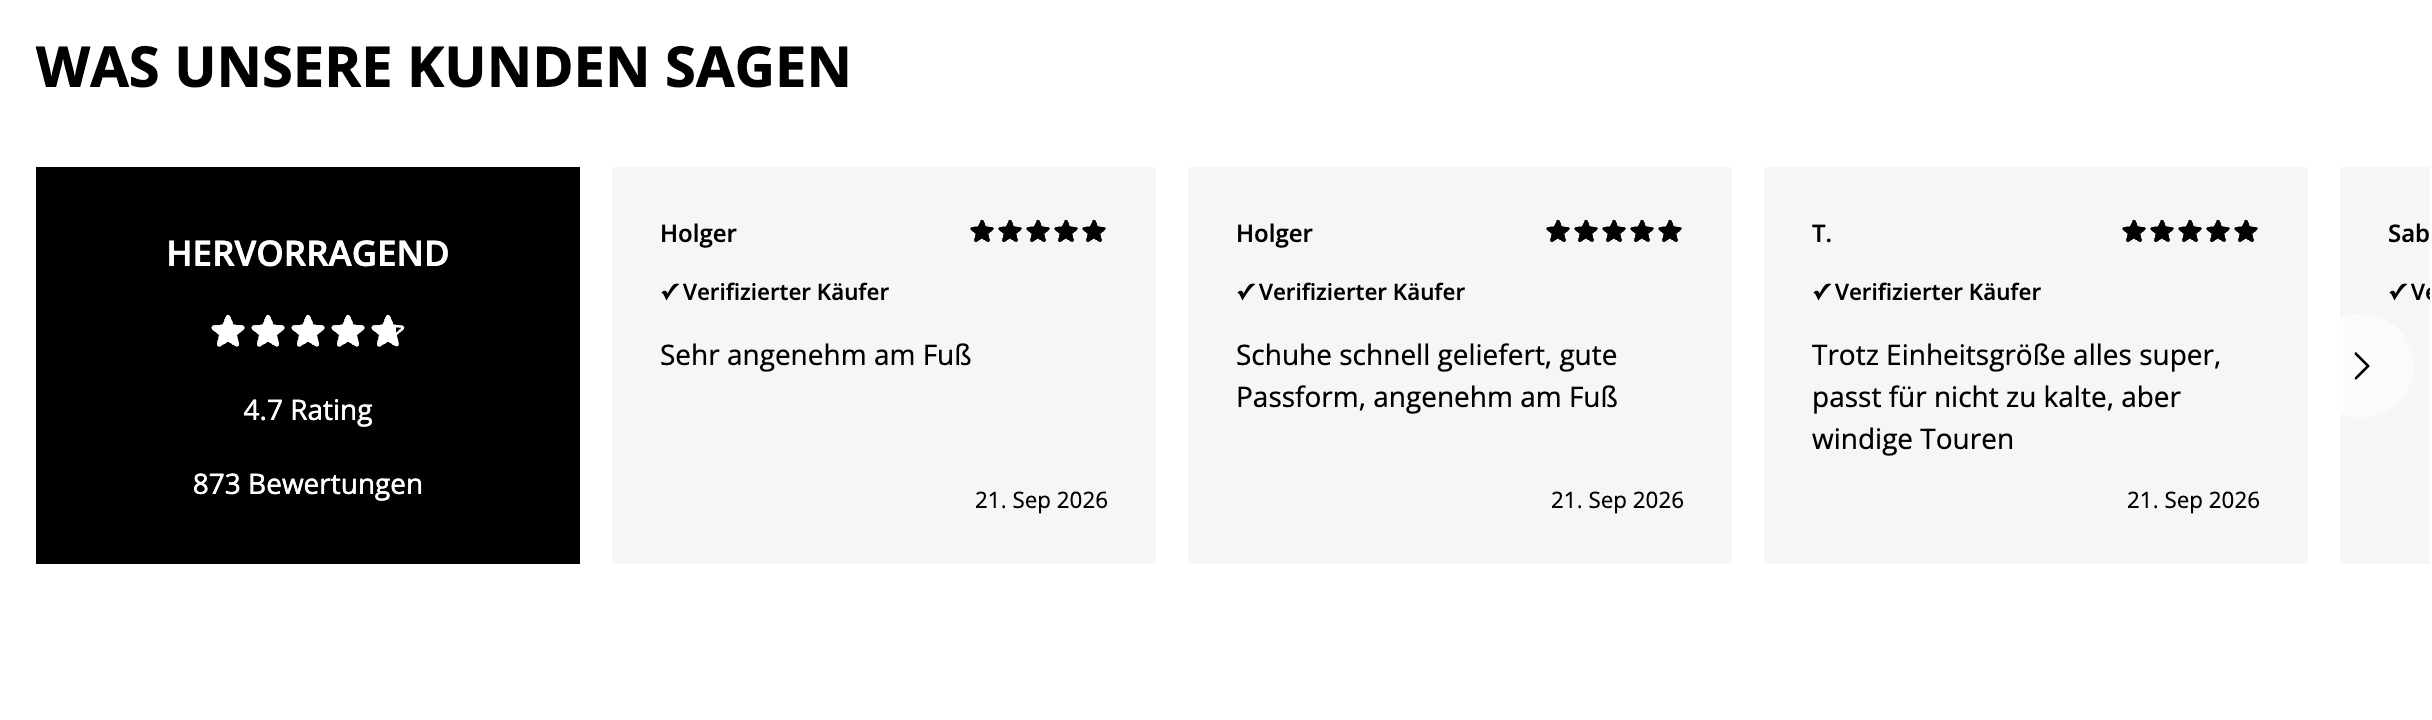
Reviews in Giesswein’s design, throughout the store
The homepage slider follows the Figma design with a black summary card and custom review cards. On mobile, the summary sits above the slider to leave more room for the reviews. Sections and app blocks can be placed in the theme editor and reused on other templates.
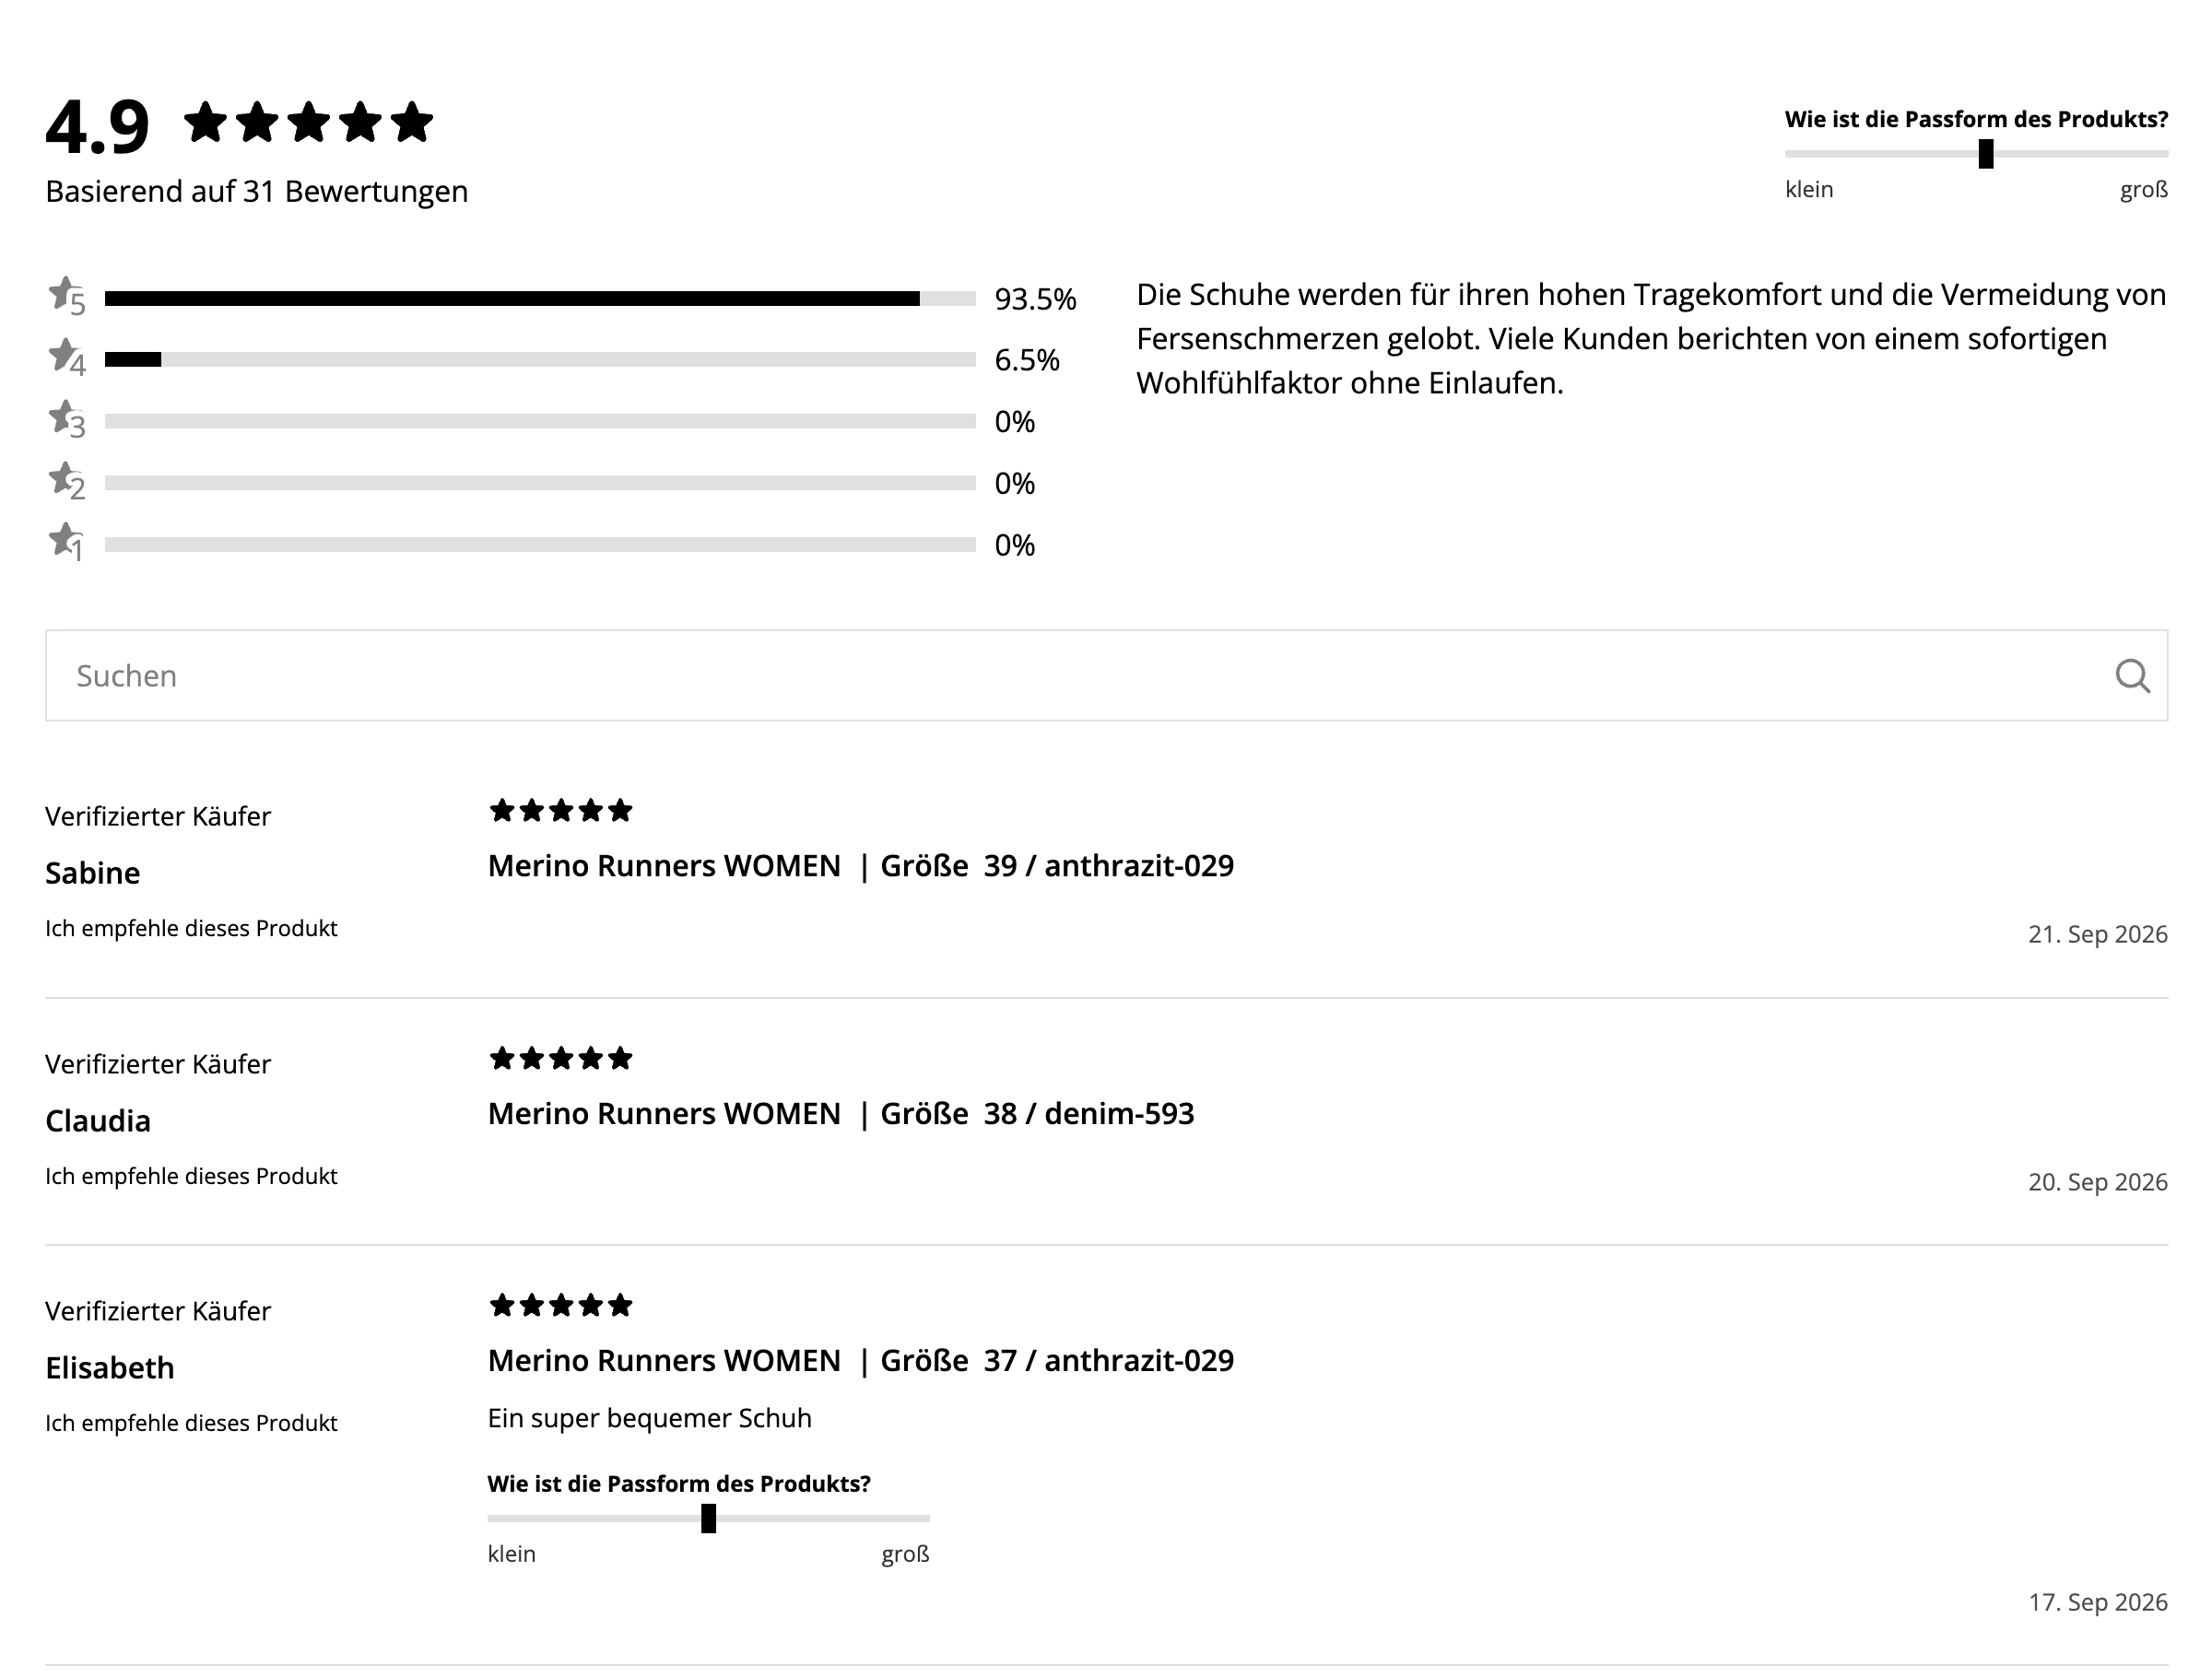
- Find relevant reviews
- The PDP review list combines a star distribution with clickable filters, a prominent search field and an AI summary. Reviews also display the variant, fit response and merchant reply. Typography, spacing and layout are customised directly in the theme.
- Ratings in dynamically loaded content too
- Collection product cards, search results, predictive search, cart pages, cart drawers, recommendations and featured sections use the same rating component. It uses the Shopify product ID and rating metafields and also works when content loads dynamically.
Collecting and displaying reviews: two separate jobs
- 01
REVIEWS.io
The existing provider remains in place for review requests and the reviews collected there.
- 02
Sync to Shopify
The app’s connector imports reviews and additional attributes. Filters and mapping associate them with the right product.
- 03
Custom theme
Native Shopify data powers ratings, reviews and fit advice in the store’s design.
03
Match store identifiers, variants and products correctly
REVIEWS.io uses identifiers such as GWEUDE-74-10-49315-022-36: a store prefix, article number, colour and size in one SKU. Import filters and product mapping are configured for this structure in the new store. Relevant reviews reach the right Shopify product instead of being lost through mismatched identifiers.
- Import the relevant data
- The store prefix identifies the intended dataset. Incomplete identifiers such as GWEUDE- alone are excluded. Matching accounts for the article number and variant structure.
- More than text and stars
- The REVIEWS.io connector also imports fit attributes, verification status and public merchant replies. Import and webhooks for new or updated reviews provide the foundation for ongoing synchronisation.
04
Directly in the HTML: for customers, Google and AI
The PDP rating and initial review list are rendered server-side with Liquid. Stars do not have to wait for the external REVIEWS.io widget to insert them. This removes that source of layout shifts during loading. JavaScript adds interactive features such as search, filters and loading further reviews.
The product page also includes Product JSON-LD with AggregateRating and individual Reviews. Average rating, count, review text and star rating are associated with the product in structured data that search engines and AI crawlers can read.
<script type="application/ld+json">
{
  "@context": "https://schema.org",
  "@type": "Product",
  "name": "Merino Runners WOMEN",
  "aggregateRating": {
    "@type": "AggregateRating",
    "ratingValue": "4.9",
    "reviewCount": 31
  },
  "review": [
    {
      "@type": "Review",
      "reviewBody": "Ein super bequemer Schuh",
      "reviewRating": {
        "@type": "Rating",
        "ratingValue": 5.0
      }
    },
    ...
  ]
}
</script>05
Performance & Lighthouse
More social proof with a nearly unchanged overall score.
Ratings and initial reviews arrive with the product page, without waiting for an external review widget. Across the homepage, collection and product page, the average Lighthouse score is 61.2 without and 61.5 with the integration. On the mobile product page, the score drops from 53.5 to 48.7. With the integration, CLS, which measures layout shifts, is 0.026 on that page on mobile and 0.004 on desktop. The table shows every individual result, including improvements and regressions.
Without integration
With integration
Mean performance score across all pages and devices
Google PageSpeed Insights, 21 September 2026. Means from 120 individual measurements: three page types × two devices × two variants × ten runs. Measured in Shopify Preview (*.shopifypreview.com, pb=0). Values and differences are rounded separately.
Lighthouse scores compared side by side
Performance score from 0 to 100 · Mean values
Full measurement comparison
For each metric, the value without the review integration is on the left and the value with it is on the right. The change is shown underneath: green means better, red means worse. Higher performance scores are better; lower values are better for the other metrics. Lighthouse results vary between runs.
| Page / device | Performance | FCP | LCP | TBT | CLS | Speed Index | Transfer size |
|---|---|---|---|---|---|---|---|
| Mean · All test groups | 61.2 → 61.5(+0.3) | 1.8 s → 1.8 s(0.0 s) | 4.7 s → 4.9 s(+0.2 s) | 603 ms → 628 ms(+25 ms) | 0.005 → 0.009(+0.004) | 3.7 s → 3.7 s(0.0 s) | 1,871 KiB → 1,876 KiB(+5 KiB) |
| Mean · Mobile | 54.9 → 55.4(+0.5) | 3.1 s → 3.0 s(-0.1 s) | 7.8 s → 8.1 s(+0.3 s) | 500 ms → 478 ms(-22 ms) | 0.002 → 0.012(+0.010) | 5.5 s → 5.6 s(+0.1 s) | 1,838 KiB → 1,883 KiB(+45 KiB) |
| Mean · Desktop | 67.5 → 67.6(+0.1) | 0.6 s → 0.6 s(0.0 s) | 1.6 s → 1.6 s(0.0 s) | 705 ms → 778 ms(+73 ms) | 0.008 → 0.007(-0.001) | 1.8 s → 1.8 s(0.0 s) | 1,904 KiB → 1,869 KiB(-35 KiB) |
| Homepage · Mobile | 52.2 → 57.7(+5.5) | 3.1 s → 2.8 s(-0.3 s) | 7.9 s → 8.4 s(+0.5 s) | 542 ms → 374 ms(-168 ms) | 0.000 → 0.000(0.000) | 6.4 s → 6.1 s(-0.3 s) | 1,955 KiB → 2,069 KiB(+114 KiB) |
| Collection · Mobile | 59.1 → 59.8(+0.7) | 3.0 s → 2.9 s(-0.1 s) | 6.7 s → 6.5 s(-0.2 s) | 476 ms → 456 ms(-20 ms) | 0.007 → 0.009(+0.002) | 4.5 s → 4.5 s(0.0 s) | 1,504 KiB → 1,511 KiB(+7 KiB) |
| Product page · Mobile | 53.5 → 48.7(-4.8) | 3.1 s → 3.2 s(+0.1 s) | 8.8 s → 9.4 s(+0.7 s) | 484 ms → 604 ms(+120 ms) | 0.000 → 0.026(+0.026) | 5.8 s → 6.2 s(+0.4 s) | 2,054 KiB → 2,070 KiB(+16 KiB) |
| Homepage · Desktop | 61.2 → 60.2(-1.0) | 0.6 s → 0.6 s(0.0 s) | 1.7 s → 1.8 s(+0.1 s) | 817 ms → 812 ms(-5 ms) | 0.002 → 0.001(-0.001) | 2.5 s → 2.5 s(0.0 s) | 1,853 KiB → 1,865 KiB(+12 KiB) |
| Collection · Desktop | 73.1 → 74.9(+1.8) | 0.6 s → 0.6 s(0.0 s) | 1.5 s → 1.5 s(0.0 s) | 503 ms → 500 ms(-3 ms) | 0.020 → 0.015(-0.005) | 1.4 s → 1.3 s(-0.1 s) | 1,524 KiB → 1,531 KiB(+7 KiB) |
| Product page · Desktop | 68.1 → 67.7(-0.4) | 0.6 s → 0.6 s(0.0 s) | 1.6 s → 1.5 s(-0.1 s) | 794 ms → 1,023 ms(+229 ms) | 0.002 → 0.004(+0.002) | 1.6 s → 1.7 s(+0.1 s) | 2,335 KiB → 2,213 KiB(-122 KiB) |
FCP: First Contentful Paint · LCP: Largest Contentful Paint · TBT: Total Blocking Time · CLS: Cumulative Layout Shift · Speed Index: how quickly page content becomes visible
More information about Google PageSpeed Insights